


A mean calculator is a simple tool for finding the average of numbers.
It adds the values and divides the total by their number.
You can use it for quick and accurate mean calculation.
Need to find an average without doing the math by hand?
A mean calculator gives you the answer in just seconds.
It makes everyday statistics easier and faster.
You can enter your data values and get the mean instantly.
It works with school, business, and other numerical data.
It also helps you understand the average of a dataset.
What Is a Mean?
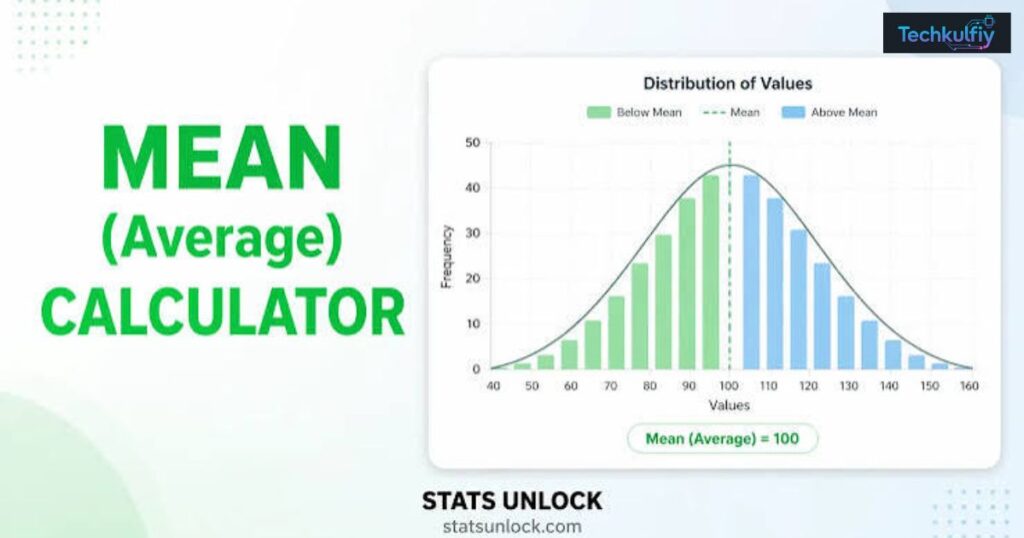
The mean is the average of a group of numerical values. To find it, you add the sum of all values and divide that total by the total number of values. This process gives you the arithmetic mean, which is often simply called the average. ([Scribbr][1])
For example, imagine five students receive the following test scores:
| Student | Score |
|---|---|
| Student 1 | 70 |
| Student 2 | 75 |
| Student 3 | 80 |
| Student 4 | 85 |
| Student 5 | 90 |
The sum of values is 400. There are five observations, so the mean is 400 ÷ 5 = 80.
Therefore, the mean of a dataset is 80.
In simple terms, the mean tells you what the average of numbers would be if the total value were shared equally among all observations. This makes the mean useful for summarizing data points and understanding the general level of a dataset.
The mean is also one of the three major measures of central tendency, along with the median and mode. The mean uses every value in the calculation, while the median focuses on the middle position and the mode identifies the most frequent value. ([Scribbr][2])
A useful way to remember the concept is:
Mean = total of the values ÷ number of values
This simple rule is the foundation of most mean calculation methods.
How to Use the Mean Calculator
Using a mean calculator is usually straightforward. You provide the numbers you want to analyze, and the calculator performs the required statistical calculation.
First, collect the data values you want to analyze. These might be test scores, monthly expenses, temperatures, sales amounts, ages, or other numerical measurements.
Next, enter data values into the calculator. Depending on the tool, you may enter numbers separated by commas, spaces, or separate lines.
The calculator then determines the sum of all values and counts the total number of values. Finally, it divides the sum by the number of observations.
For example, suppose your data is:
10, 20, 30, 40, 50
The calculator adds the values:
10 + 20 + 30 + 40 + 50 = 150
There are five values.
150 ÷ 5 = 30
Therefore, the dataset mean is 30.
Some tools may also let you choose between a sample option and a population option. This distinction becomes important when you are using the result for statistical analysis.
A basic statistics calculator can be useful when you need quick results, especially when a dataset contains many observations. However, understanding the underlying formula is still important because it helps you check whether the result makes sense.
How Does the Mean Calculator Work?
A mean calculator follows the same basic mathematical process you can use by hand. It first identifies every value in the dataset. It then adds the values and determines how many observations are present.
The basic process can be represented as:
| Stage | What happens |
|---|---|
| 1 | The calculator reads the data values |
| 2 | It adds the values together |
| 3 | It counts the number of observations |
| 4 | It divides the total by the count |
| 5 | It displays the mean |
Suppose you enter 12, 15, 18, 20, and 25. The calculator finds the total:
12 + 15 + 18 + 20 + 25 = 90
The number of observations is 5.
Therefore:
90 ÷ 5 = 18
The result is an average of 18.
The process remains the same whether you use a sample mean calculator or a population mean calculator. The main difference is how the dataset is classified and which statistical notation you use.
A sample represents a subset of a population, while a population represents the entire population being studied. ([Scribbr][2])
For example, if a university wants to know the average GPA of every student enrolled, all student GPAs would represent the population. If researchers select 200 students from that university, those 200 students represent a sample.
Understanding this difference prevents confusion when interpreting your result.
Mean Formula
The basic mean formula is simple. You add every value and divide the total by the number of observations.
For a sample, the commonly used notation is:
x̄ = Σxi ÷ n
Here, x-bar or x̄ represents the sample mean. Σxi represents the sum of the individual observations, while n represents the sample size.
For a population, the notation changes:
μ = Σxi ÷ N
Here, μ (mu) represents the population mean. Σxi represents the sum of the population values, while N represents the population size.
The important symbols can be understood through this table:
| Symbol | Meaning |
|---|---|
| x-bar | Sample mean |
| μ (mu) | Population mean |
| Σx | Sum of the values |
| Σxi | Sum of individual observations |
| n | Number of observations in a sample |
| N | Number of observations in a population |
The calculation itself is not complicated. The main challenge is identifying whether your numbers represent a sample or the complete population.
The average formula is therefore closely related to the mean formula. In basic statistics, both describe the process of adding values and dividing by the number of values.
genui{“learning_viz”:{“type_id”:”ARITHMETIC_MEAN”,”initial_values”:{“observation1″:2,”observation2″:4,”observation3”:7}}}
This equal-sharing idea is a useful way to understand why the arithmetic mean works. The total amount stays the same, but it is redistributed equally across the observations.
What Is Sample Mean?
A sample mean is the average calculated from a sample rather than an entire population. Researchers often use sample data because collecting information from every member of a population may be expensive, slow, or impractical.
For example, imagine a company has 10,000 customers and wants to know how much customers spend on average. Instead of asking all 10,000 customers, the company might select 500 customers.
Those 500 customers are the sample.
The average spending of those 500 customers is the sample mean.
The sample mean symbol is commonly written as x-bar, or x̄. The sample mean formula is:
x̄ = Σxi ÷ n
Here, n is the sample size, while Σxi represents the sum of the observations in the sample.
Sample Mean Formula
The sample mean formula can be used whenever you have a collection of sample observations.
Suppose five randomly selected employees report their weekly commuting costs:
| Employee | Weekly Cost |
|---|---|
| A | $40 |
| B | $55 |
| C | $35 |
| D | $70 |
| E | $50 |
The total is:
$40 + $55 + $35 + $70 + $50 = $250
The sample contains five observations.
Therefore:
x̄ = $250 ÷ 5 = $50
The mean of a sample is therefore $50.
The sample mean is important because it can be used as an estimate of the population mean. In statistics, researchers commonly use sample statistics to learn about larger populations. ([Scribbr][3])
How to Calculate Sample Mean
To calculate the mean of sample data, first identify every observation. Then add all values and divide the result by the sample size.
The calculation can be summarized as:
| Information | Value |
|---|---|
| Sample data | 40, 55, 35, 70, 50 |
| Sum of all values | 250 |
| Sample size | 5 |
| Sample mean | 50 |
A sample mean calculator performs these steps automatically, but knowing the process makes it easier to verify the answer.
What Is Population Mean?
A population mean is the average of every value in the population being studied. Unlike a sample, a population includes the complete group relevant to the research question.
For example, suppose a small company has exactly 20 employees and wants to calculate the average age of all employees. If the company collects the age of all 20 employees, the resulting value is the population mean.
The population mean symbol is μ (mu).
The population mean formula is:
μ = Σxi ÷ N
Here, Σxi represents the sum of all population values, and N represents the population size.
Population Mean Formula
Consider a small class with six students whose scores are:
70, 75, 80, 85, 90, 100
The total is:
70 + 75 + 80 + 85 + 90 + 100 = 500
The population contains six observations.
Therefore:
μ = 500 ÷ 6 = 83.33
The mean of a population is approximately 83.33.
When you have information for the entire population, you do not need to estimate the population mean from a sample. You can calculate it directly.
How to Calculate Population Mean
The process is almost identical to calculating a sample mean.
You add all population values, determine the population size, and divide the total by that size.
The key difference is the dataset itself.
If your numbers represent a complete population, use the population interpretation. If they represent only part of a larger population, use the sample interpretation.
Sample Mean vs Population Mean
The sample mean vs population mean distinction is one of the most important concepts to understand when using a mean calculator.
The mathematical process looks almost identical. The main difference is whether the data represents a sample or the entire population.
| Feature | Sample Mean | Population Mean |
|---|---|---|
| Symbol | x-bar | μ (mu) |
| Dataset | Sample data | Population data |
| Size symbol | n | N |
| Formula | Σxi ÷ n | Σxi ÷ N |
| Represents | A subset | The entire population |
| Common purpose | Estimate population characteristics | Describe the complete population |
The difference between sample and population mean becomes clearer with a simple example.
Imagine the United States has millions of households. If researchers randomly select 1,000 households and calculate their average monthly electricity bill, that result is a sample mean.
If researchers somehow collect the electricity bill data for every household included in the defined population, the result would be a population mean.
A sample mean can help researchers estimate population characteristics, but it is not automatically identical to the population mean. The difference depends on the sample and the population. ([Scribbr][3])
The following case study shows why the distinction matters.
Case Study: Average Customer Spending
Imagine a retail store has 5,000 customers in a year. The owner wants to understand average customer spending.
Collecting all 5,000 spending records gives population data. Suppose the total spending is $750,000.
The population mean would be:
$750,000 ÷ 5,000 = $150
Now imagine the owner randomly selects 200 customers. Their total spending is $31,000.
The sample mean would be:
$31,000 ÷ 200 = $155
The two results are different because the sample represents only a portion of the population.
This example also shows why sample selection matters when performing data analysis. A poorly selected sample may not represent the larger population accurately.
How to Calculate Mean Step by Step
Learning how to calculate the mean manually is useful even when you regularly use an online calculator. It lets you understand the result and catch simple data-entry errors.
Step 1: Collect the Data Values
Start with the complete set of values you want to analyze.
For example:
12, 18, 20, 25, 30
These are your observations.
Step 2: Find the Sum of All Values
Add every value together:
12 + 18 + 20 + 25 + 30 = 105
The sum of all values is 105.
Step 3: Count the Observations
There are five values in the dataset.
Therefore, the number of observations is 5.
Step 4: Apply the Mean Formula
Divide the sum by the number of observations:
105 ÷ 5 = 21
Step 5: Interpret the Result
The mean is 21.
This means the average of the dataset is 21.
The calculation can be summarized in one table:
| Step | Calculation | Result |
|---|---|---|
| Data | 12, 18, 20, 25, 30 | — |
| Sum | 12 + 18 + 20 + 25 + 30 | 105 |
| Observations | Count of values | 5 |
| Mean | 105 ÷ 5 | 21 |
This same method works with positive numbers, negative numbers, decimals, test scores, prices, measurements, and many other forms of numerical data.
One important point is that every valid observation should be included. Leaving out a value can change the final result.
Mean Calculation Examples
Real examples make mean calculation easier to understand. The following examples show how a mean calculator can be used in different situations.
Example 1: Average Test Score
Suppose a student has five test scores:
78, 82, 91, 85, 94
The total is 430.
There are five scores.
Therefore:
430 ÷ 5 = 86
The student’s average score is 86.
This type of calculation is common in education. A teacher can use a mean calculator to quickly calculate the average score for a class or group of assignments.
Example 2: Average Monthly Expenses
Suppose a person records five monthly expenses:
| Month | Expense |
|---|---|
| January | $1,200 |
| February | $1,350 |
| March | $1,100 |
| April | $1,450 |
| May | $1,400 |
The total is $6,500.
There are five observations.
Therefore:
$6,500 ÷ 5 = $1,300
The average of numbers in this dataset is $1,300.
The result gives a simple summary of average monthly spending.
Example 3: Mean With a Decimal
Consider this dataset:
2.5, 3.5, 4.0, 5.5
The sum is 15.5.
There are four observations.
Therefore:
15.5 ÷ 4 = 3.875
The mean is 3.875.
A calculator becomes particularly useful when datasets contain many decimal values because manual calculations can become tedious.
Example 4: Mean With an Outlier
Consider these values:
10, 12, 11, 13, 100
The sum is 146.
There are five observations.
Therefore:
146 ÷ 5 = 29.2
The mean becomes 29.2 even though four of the five values are close to 10–13.
This happens because the mean uses every value in the dataset. An unusually large or small observation can significantly affect the result. ([Scribbr][2])
This is why you should not always rely on the mean alone. When data contains strong outliers or a highly skewed distribution, the median may provide a different and sometimes more representative view of the center. ([Scribbr][4])
Example 5: Negative Numbers
Suppose your data is:
-10, -5, 0, 5, 10
The sum is zero.
There are five observations.
Therefore:
0 ÷ 5 = 0
The mean is zero.
This example shows that a mean does not need to be one of the original values. It can be a number that falls between or outside the individual observations.
Mean Calculation Quick Reference
| Dataset | Sum | Number of Values | Mean |
|---|---|---|---|
| 10, 20, 30 | 60 | 3 | 20 |
| 5, 10, 15, 20 | 50 | 4 | 12.5 |
| 70, 80, 90 | 240 | 3 | 80 |
| -10, -5, 0, 5, 10 | 0 | 5 | 0 |
These examples demonstrate the basic mean in math. The same principle applies whether you are working with classroom exercises, business data, scientific measurements, or personal records.
Frequently Asked Questions About Mean Calculator
What is a mean calculator?
A mean calculator is a tool that calculates the average of a set of numerical values. It normally adds the values and divides the total by the number of observations.
What is the difference between mean and average?
In basic mathematics and statistics, mean often refers to the arithmetic average. It is calculated by adding all values and dividing the total by the number of values.
How do I calculate the mean?
To calculate average, add all values together and divide the total by the number of observations. The result is the arithmetic mean.
What is a sample mean?
A sample mean is the average calculated from sample data. Its common symbol is x-bar, or x̄.
What is a population mean?
A population mean is the average calculated from all values in the population. Its common symbol is μ (mu).
What do n and N mean in the mean formula?
In the mean formula, n normally represents the number of observations in a sample, while N represents the number of observations in a population.
Can a mean calculator handle negative numbers?
Yes. Negative numbers can be included in a normal arithmetic mean calculation. The values are added according to their mathematical signs before the total is divided by the number of observations.
Can the mean be a decimal?
Yes. A mean can be a whole number or a decimal. The result depends on the values in the dataset and the total number of observations.
What is the difference between sample mean and population mean?
The difference between sample and population mean mainly comes from the type of data being analyzed. A sample mean describes a subset, while a population mean describes the entire population.
Why can an outlier change the mean?
The arithmetic mean uses every value in the calculation. Therefore, an extremely high or low value can pull the mean toward itself. ([Scribbr][2])
Is the mean always the best measure of central tendency?
Not necessarily. The mean is widely used, but the median can be more useful when a dataset contains substantial skew or extreme outliers. ([Scribbr][4])
Final Thoughts on Mean Calculator
A mean calculator provides a fast way to find the average of a dataset, but understanding the mathematics behind it makes the result more meaningful. The basic process is simple: find the sum of values, count the number of observations, and divide the total by that count.
The most important distinction is between a sample mean and a population mean. A sample represents a subset of a population, while a population contains the complete group being studied. The formulas look similar, but the notation uses n for a sample and N for a population.
Whether you are checking an average score, analyzing business numbers, studying statistics, or working with everyday numerical data, understanding the mean formula gives you a reliable foundation for basic statistics and mathematics. An online mean calculator can make the process faster, while knowing how to calculate the mean manually helps you understand and verify the answer.
Meta description
Use our Mean Calculator to find the average of numbers quickly and accurately. Calculate sample and population means with ease.
