

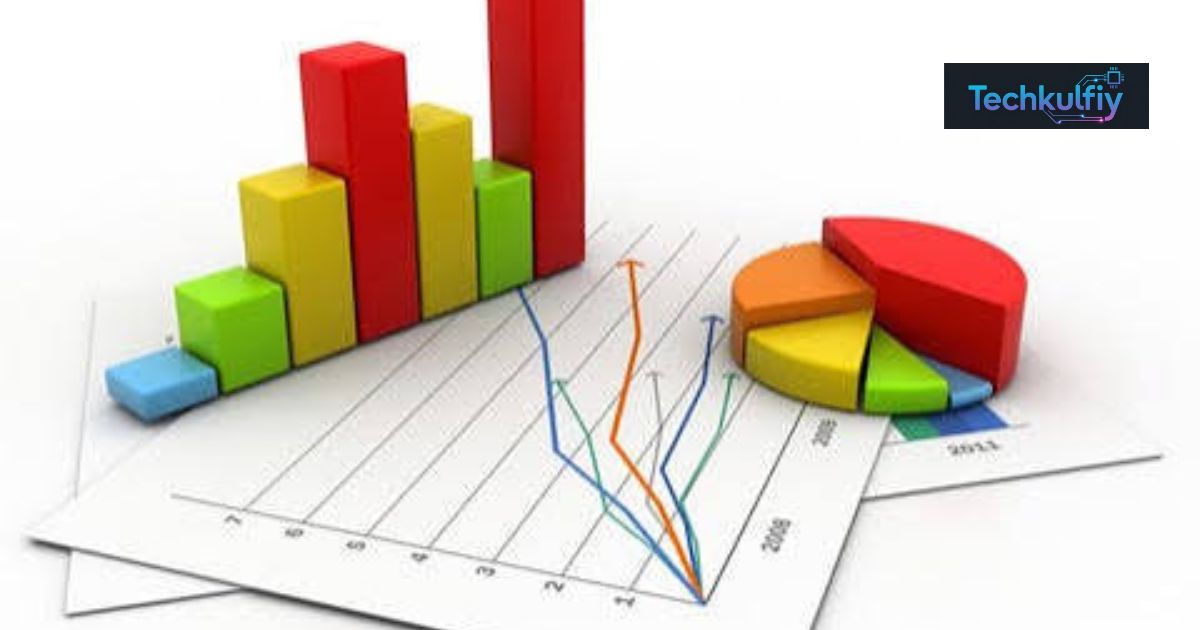
Statistics is the study of collecting and analyzing data.
It helps explain numbers, patterns, and useful information.
Statistics supports better decisions using clear data and facts.
Numbers can tell a story when you know how to read them.
Statistics helps you find patterns hidden inside large datasets.
It makes complex information easier to understand and compare.
Statistics is used in business, science, healthcare, and education.
It includes methods such as mean, median, mode, and probability.
It also helps researchers study trends and make predictions.
What Is Statistics?
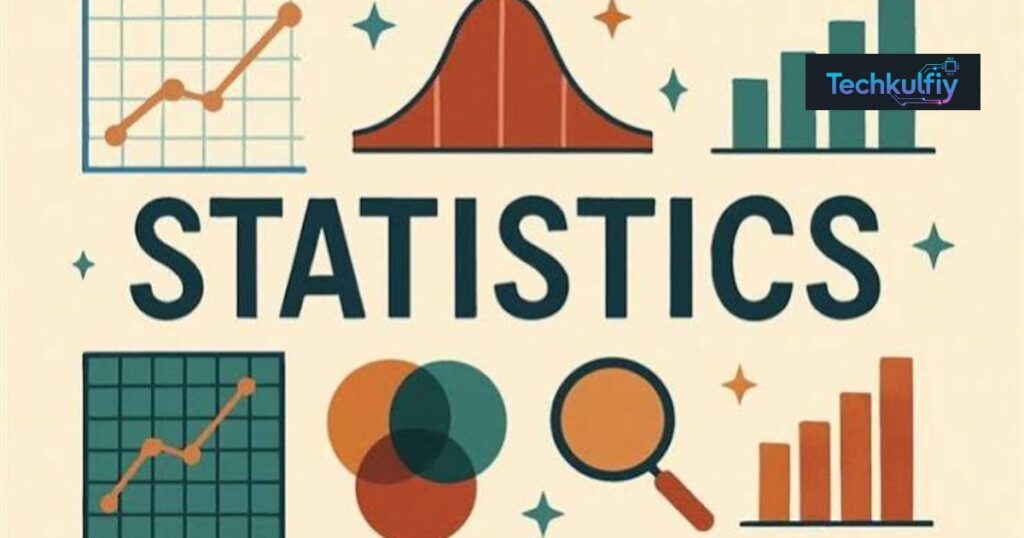
Statistics is the study of information collected from observations, experiments, surveys, and other sources. It involves collecting data, organizing it, presenting data, analyzing data, and interpreting data so useful conclusions can be drawn.
The word statistics can describe both a field of study and numerical information. For example, a company may report that its sales increased by 15%. That number is a statistic. However, determining why sales increased requires statistical analysis and data interpretation.
Statistics helps researchers understand large amounts of information without examining every individual case. A researcher may study a smaller sample and use statistical inference to learn about a larger population.
For example, suppose a researcher wants to understand the average amount Americans spend on groceries each month. Studying every household in the United States would be difficult and expensive. Instead, the researcher can collect statistical data from a carefully selected sample.
The sample represents part of the larger population. Researchers then use statistical methods to examine the sample and estimate characteristics of the wider population.
| Statistical Term | Simple Meaning | Example |
|---|---|---|
| Population | The complete group being studied | All U.S. households |
| Sample | A smaller group selected from the population | 5,000 U.S. households |
| Variable | A characteristic that can change | Monthly grocery spending |
| Data | Information collected about variables | $400, $520, $680 |
| Parameter | A value describing a population | True average spending |
| Statistic | A value calculated from a sample | Sample average spending |
Statistics is not simply about calculating numbers. It is about understanding what those numbers mean. Good statistical work considers how information was collected, whether the sample represents the population, and whether the method used is suitable for the question.
Why Is Statistics Used?
The main purpose of statistics is to make large or complex sets of information easier to understand. Statistical analysis can help with identifying patterns, measuring changes, comparing groups, and understanding relationships between variables.
Businesses use statistics to examine marketing data and customer behavior. Hospitals use medical statistics to study treatments and patient outcomes. Economists analyze economic data to understand employment, inflation, production, and consumer spending.
Statistics also supports data-driven decisions. Instead of relying only on assumptions, people can examine evidence before making choices.
Types of Statistics
There are two major types of statistics: descriptive statistics and inferential statistics. These two areas are closely related, but they serve different purposes.
Descriptive statistics summarizes the information that has already been collected. Inferential statistics uses sample information to make estimates or conclusions about a larger population.
Descriptive Statistics
Descriptive statistics focuses on describing a dataset. It does not attempt to make broad conclusions beyond the information being analyzed.
Common descriptive measures include the mean, median, mode, range, variance, and standard deviation. Tables, charts, percentages, and graphs are also forms of descriptive analysis.
For example, a school may calculate the average test score of 200 students. The average score describes those 200 students. It does not automatically prove that every student in the country would achieve the same result.
Descriptive statistics often examines descriptive data, central tendency, and data distribution. It gives researchers a clear starting point before they perform more advanced analysis.
Inferential Statistics
Inferential statistics goes beyond simply describing collected information. It uses a sample to make estimates or statistical conclusions about a larger population.
Researchers use statistical inference, confidence intervals, hypothesis testing, and probability-based methods to evaluate evidence.
For example, a polling organization may survey a sample of U.S. adults to estimate opinions across a much larger population. The result is an estimate rather than a perfect measurement of every individual.
| Feature | Descriptive Statistics | Inferential Statistics |
|---|---|---|
| Main purpose | Summarize data | Draw conclusions about a population |
| Common tools | Mean, median, mode, range | Hypothesis testing, regression, confidence intervals |
| Focus | Observed data | Sample and larger population |
| Example | Average test score | Estimate national average |
| Main result | Description | Statistical inference |
Both approaches are important. Descriptive statistics helps you understand what the data says. Inferential statistics helps you determine what the data may suggest about a wider population.
Mean, Median, and Mode in Statistics
The mean, median, and mode are common measures of central tendency. They help identify an average value or typical value within a dataset.
The mean is calculated by adding all values and dividing the total by the number of values. Suppose five people earn $40,000, $45,000, $50,000, $55,000, and $60,000 per year. Their mean income is $50,000.
The median is the middle value after the numbers are arranged from smallest to largest. If a dataset contains an odd number of observations, the middle number is the median. With an even number of observations, the median is usually calculated by averaging the two middle values.
The mode is the value that appears most often. A dataset can have one mode, multiple modes, or no mode.
These three measures can produce very different results when extreme values appear. Consider household income. If most households earn between $50,000 and $100,000 but a few households earn millions of dollars, the mean can become much higher than the median.
This is why researchers must consider the data distribution before choosing an appropriate measure of central tendency.
| Measure | Meaning | Useful When |
|---|---|---|
| Mean | Arithmetic average | Data has no major extreme values |
| Median | Middle value | Data is skewed |
| Mode | Most frequent value | Repeated or categorical values matter |
The mean median mode combination gives a useful basic picture of a dataset. However, these measures do not describe everything. Researchers may also examine the range of data, variance, and standard deviation.
Statistical Data and Variables
Statistical data refers to information collected for analysis. It can come from surveys, experiments, observations, databases, government records, business systems, or scientific research.
A variable is a characteristic that can have different values. For example, age, income, temperature, education level, and number of purchases are all possible statistical variables.
Variables can be classified in different ways. Quantitative data represents numerical quantities, while qualitative data describes categories or qualities.
Quantitative variables can also be divided into discrete variables and continuous variables. A discrete variable has countable values. The number of products sold is one example. A continuous variable can take many possible values within a range, such as height, weight, or temperature.
| Data Type | Meaning | Example |
|---|---|---|
| Quantitative data | Numerical information | Income |
| Qualitative data | Categories or descriptions | Favorite brand |
| Discrete variables | Countable values | Number of customers |
| Continuous variables | Values within a range | Temperature |
The type of variable matters because it affects which statistical method should be used. A technique that works well for numerical measurements may not be suitable for categorical information.
Good research therefore begins with understanding the nature of the data before selecting a statistical technique.
Levels of Measurement in Statistics
The levels of measurement describe how variables are categorized and what mathematical operations can reasonably be performed on them. The four main levels are nominal, ordinal, interval, and ratio.
Nominal data consists of categories without a meaningful order. Examples include state names, eye color, and product categories.
Ordinal data has a meaningful order, but the distance between categories may not be equal. Customer satisfaction ratings such as poor, fair, good, and excellent are examples.
Interval data has ordered values with equal differences between them, but it does not have a true zero. Temperature measured in Celsius is a common example.
Ratio data has equal intervals and a meaningful zero. Height, weight, age, and income are examples.
| Level | Order | Equal Differences | True Zero | Example |
|---|---|---|---|---|
| Nominal | No | No | No | State |
| Ordinal | Yes | Not necessarily | No | Satisfaction level |
| Interval | Yes | Yes | No | Celsius temperature |
| Ratio | Yes | Yes | Yes | Income |
Understanding these categories helps researchers select suitable statistical procedures. These measurement levels are especially important in surveys, experiments, and statistical research.
Statistical Methods and Techniques
Different research questions require different statistical methods. There is no single technique that works for every dataset.
Probability is an important foundation. Probability theory explains the likelihood of events occurring. Statistical probability is widely used when researchers work with uncertainty and random outcomes.
Researchers also measure data variability. Variance shows how much values differ from the mean. Standard deviation provides another way to describe how spread out observations are.
For example, two classes could have the same average test score. One class may have scores clustered closely around the average. The other may have students with extremely high and low scores. Their averages are identical, but their variability is different.
Correlation and Regression
Correlation analysis examines whether two variables move together. A positive correlation means that two variables tend to increase together. A negative correlation means that one tends to decrease as the other increases.
Correlation does not automatically prove causation. If ice cream sales and swimming activity both increase during summer, that does not mean ice cream causes people to swim. A third factor, such as warmer weather, may influence both.
Regression analysis provides a more detailed way to study relationships between variables. It can estimate how changes in one variable relate to changes in another.
In regression, the dependent variable is the outcome being studied. An independent variable is a factor used to explain or predict changes in the outcome. Researchers may also use multiple explanatory variables in a statistical model.
Hypothesis Testing
Hypothesis testing is a method used to evaluate claims about a population. Researchers begin with a statistical hypothesis and use sample evidence to determine whether the evidence is strong enough to challenge the assumption being tested.
A p-value may be used as part of this process. Researchers may also calculate confidence intervals and effect sizes.
Statistical significance does not necessarily mean that a result is important in practical terms. A very small effect can become statistically significant when a study has a large sample size. Researchers should therefore consider both statistical and practical importance.
| Statistical Method | Main Purpose |
|---|---|
| Mean | Find average value |
| Variance | Measure variability |
| Standard deviation | Measure spread |
| Correlation analysis | Examine relationships |
| Regression analysis | Model relationships and estimate outcomes |
| Hypothesis testing | Evaluate statistical claims |
| Probability | Measure uncertainty |
| Data visualization | Present patterns clearly |
Modern research may combine several techniques. Researchers often begin with descriptive statistics, examine relationships, build statistical models, and then use statistical inference to interpret their findings.
Sampling Techniques in Statistics
Studying an entire population is not always practical. Researchers often use a sample to represent a larger group. The process of selecting that sample is called data sampling.
A sample should reflect important characteristics of a sample and the population from which it comes. A poorly selected sample can produce misleading results even when the sample size is large.
Several sampling techniques are commonly used.
Random sampling gives members of a population a known chance of selection. Systematic sampling selects observations at regular intervals after a starting point has been established.
Stratified sampling divides a population into groups and selects samples from those groups. Cluster sampling divides the population into clusters and then selects entire clusters or observations within selected clusters.
| Sampling Method | Basic Idea | Example |
|---|---|---|
| Random sampling | Select randomly | Randomly select U.S. households |
| Systematic sampling | Select at fixed intervals | Every 20th record |
| Stratified sampling | Divide into groups first | Sample by age groups |
| Cluster sampling | Select groups or clusters | Select schools from different regions |
A sample is useful because it can provide information about a larger population without requiring researchers to study every individual.
However, sampling creates uncertainty. Researchers must consider sampling error, nonresponse, selection bias, and undercoverage. A larger sample does not automatically fix a biased sampling process.
For example, imagine a national survey about internet access that only contacts people who already have reliable internet service. The survey could have a large sample size, yet its results may still fail to represent the whole population.
Uses of Statistics in Different Fields
Statistics is used in almost every major field because organizations constantly need to understand information.
In business, business statistics helps companies study sales, customer behavior, product performance, pricing, and marketing campaigns. A company can compare marketing data to determine which campaign produces more conversions.
In finance and investing, statistics helps analysts examine returns, risk, market movements, and historical patterns. Investors can use statistical models to understand uncertainty, although statistical results cannot guarantee future performance.
In healthcare, medical statistics supports clinical research, treatment comparisons, disease studies, and health outcomes. Researchers can use statistics to determine whether observed differences between treatment groups are likely to reflect meaningful evidence.
Economists analyze economic data such as employment, inflation, income, production, and consumer spending. Government agencies also use statistical information when measuring population characteristics and economic conditions.
Statistics is equally important in education, manufacturing, sports, technology, agriculture, and scientific research.
| Field | Statistical Use | Example |
|---|---|---|
| Business | Customer and sales analysis | Measuring conversion rates |
| Finance | Risk analysis | Studying investment returns |
| Healthcare | Research outcomes | Comparing treatments |
| Economics | Economic measurement | Studying inflation |
| Education | Student performance | Analyzing test scores |
| Technology | Product analytics | Measuring user activity |
| Manufacturing | Quality control | Detecting production defects |
| Sports | Performance analysis | Comparing player statistics |
Case Study: Statistics in Business
Imagine a U.S. online retailer notices that sales have fallen during one month. Looking only at total sales does not explain the problem.
The company can examine website traffic, conversion rates, average order value, customer location, device type, and marketing campaign results. This process turns raw numbers into useful data analysis.
Suppose the company discovers that website traffic remained stable, but mobile conversion rates declined. The business can then investigate whether a recent mobile website change caused the decline.
This example shows how statistics can support statistical decision-making. Instead of guessing, the company uses evidence to investigate a measurable problem.
Why Is Statistics Important?
Statistics is important because modern decisions often depend on large amounts of information. Without statistical methods, it can be difficult to separate meaningful patterns from random variation.
One major benefit is better decision-making. Organizations can use evidence to compare options, identify risks, and measure results. This supports making informed decisions instead of relying entirely on assumptions.
Statistics also plays a major role in scientific research. Researchers use statistical methods in research to evaluate experiments, examine evidence, and communicate research findings.
Another important benefit is prediction. Historical information can be used to develop statistical predictions. Businesses may forecast demand. Financial analysts may study market risk. Researchers may estimate future outcomes.
Statistics also supports data visualization. Charts, graphs, and tables make complicated datasets easier to understand. A well-designed visualization can reveal trends that are difficult to notice in a spreadsheet.
Statistics and Everyday Decisions
You may use statistical thinking more often than you realize. When you compare product reviews, examine a discount, read a medical study, or evaluate a survey, you are dealing with information that can be analyzed statistically.
For example, a product with a 4.8-star rating from 20 reviews may tell a different story from a product with a 4.6-star rating from 50,000 reviews. The rating matters, but the amount and quality of supporting information also matter.
This is why statistical measurement and context are important.
A Note About Statistical Models
A statistical model is a mathematical representation of relationships within data. Models can help researchers understand patterns and make estimates.
However, a model is only as useful as the assumptions, data, and methods behind it.
Statistician George Box famously said, “All models are wrong, but some are useful.”
The quote highlights an important idea. Statistical models simplify reality. They are tools for understanding complex systems rather than perfect copies of the real world.
Limitations of Statistics
Statistics is powerful, but it is not automatically correct. The quality of a statistical conclusion depends heavily on the quality of the data and the method used.
Poor data collection can produce misleading results. A biased sample can distort findings. Incorrect measurements can create inaccurate conclusions. An inappropriate statistical technique can also produce unreliable results.
Researchers must therefore consider how data was collected, who was included, how variables were measured, and which assumptions were made.
Another issue is confusing correlation with causation. Two variables may have a strong relationship without one directly causing the other.
Statistical results can also be misunderstood when researchers focus only on statistical significance. A result can be statistically significant while having a very small real-world effect.
Good statistical practice combines mathematical analysis with careful reasoning and context.
Frequently Asked Questions About Statistics
What Is Statistics in Simple Words?
Statistics is the study of collecting, organizing, analyzing, and interpreting information. It helps people understand patterns and make evidence-based decisions.
What Are the Two Main Types of Statistics?
The two main types are descriptive statistics and inferential statistics. Descriptive statistics summarizes observed data, while inferential statistics uses sample information to draw conclusions about a population.
What Is the Difference Between Statistics and Data?
Data is the raw information collected from observations or measurements. Statistics involves methods used to organize, analyze, and interpret that information.
What Are the Four Levels of Measurement?
The four levels are nominal, ordinal, interval, and ratio. Each level provides different information about how variables can be categorized and analyzed.
What Are the Most Common Statistical Methods?
Common methods include mean, median, mode, variance, standard deviation, correlation, regression, probability, and hypothesis testing. The correct method depends on the research question and type of data.
Why Is Statistics Important?
Statistics helps people understand information, identify patterns, evaluate claims, measure uncertainty, and make informed decisions. It is widely used in science, business, healthcare, finance, government, and education.
What Is the Difference Between a Population and a Sample?
A population is the complete group being studied. A sample is a smaller group selected from that population. Researchers use samples when studying the entire population is impractical.
Can Statistics Predict the Future?
Statistics can support estimates and forecasts, but it cannot guarantee future results. Statistical predictions depend on historical data, assumptions, uncertainty, and the quality of the model.
What Is Statistical Significance?
Statistical significance describes evidence that an observed result is unlikely to have occurred by chance under a specified statistical model or hypothesis. It does not automatically mean that the result has major practical importance.
Conclusion
Statistics provides a structured way to understand information. It combines statistical analysis, data collection, probability, mathematical reasoning, and interpretation to turn raw information into useful knowledge.
The most important concepts include descriptive statistics, inferential statistics, statistical data, statistical variables, central tendency, variability, sampling, correlation, regression, and hypothesis testing.
Understanding these ideas makes it easier to evaluate research, business reports, surveys, financial information, and everyday claims. Whether you are working with quantitative data or qualitative information, statistics gives you tools for finding patterns, measuring uncertainty, and reaching more reliable conclusions.
In a world filled with numbers, statistics is not just a mathematical subject. It is a practical skill for understanding evidence, questioning assumptions, and making better data-driven decisions.
Meta Description
Explore statistics, its definition, types, methods, examples, and importance. Learn how statistics helps analyze data and make decisions
